Compute Statistics for Layer
❖Compute Statistics for Layer is a tool available in all our spatial products and allows you to see various stats relating to any column in the data of your layer. It can be accessed in the Data tab(1)(2):

You would make sure you have the correct layer highlighted in your layer control before opening the tool(1):

Once you have opened the tool the following dialogue will come up(1). By Variable choose which column in your data you would like to get stats for(2). A graph and various figures relating to this column are populated(3):


❖Each bar in the chart represents a certain range of values in your data. Number of buckets(1) is the separate ranges of values that your data is divided up into on your graph(on the X axis). The number of bars in your chart will be affected by the number of buckets you have set. If you hover over a bar you can see the range it represents along with the Min, Max and Average(2). The smaller popup as you hover on any point in the chart gives the middle value in one of the bucket ranges along with the number of items that fall in the range in this case its zero (3):


❖The values along the Y axis are the count of how many items in your data fall within one of the ranges along the X axis. So, for example you can see there are two items in my data with a total volume between 0 and 22800(1):

❖To the left is the grid giving details about the Count, Mean, Sum etc. of your data(1):

(Distinct is the number of distinct values in your data)
❖ If you would like to get a report for selected or visible features only have Selected features only(1) or Visible features only(2) ticked on:

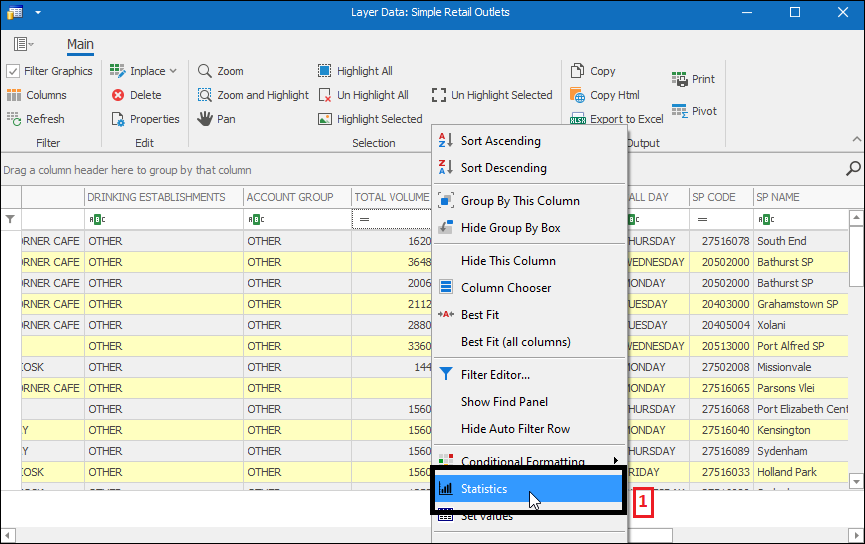
❖Another way this feature can be accessed is via the data grid of your layer. Once opened you can then right click on the header of one of the columns and click on Statistics(1) and it will bring up the stats for that column(2):